Iron deficiency increases lead absorption, competes with lead for the same transport pathways, and independently impairs neurodevelopment. For a trial testing whether chelation improves cognition in lead-exposed children, iron status is not a secondary consideration — it is a potential effect modifier of the primary outcome. If iron-deficient children respond differently to chelation than iron-replete children, failing to account for iron status would bias the trial toward a null result.
TLC collected baseline ferritin on 756 of 780 randomized participants. What happened to that data — how it was reported, where it was reported, and what was done with it — raises significant questions about the trial's handling of a known confounder.
Iron Assessment Requirements
The TLC protocol (Version 10) explicitly acknowledged ferritin as the correct tool for identifying iron deficiency:
"Serum ferritin provides a much more sensitive indicator of iron body stores than a traditional serum iron assay.... Serum ferritin is reduced in iron deficiency."
The protocol specified that ferritin would be measured using the Bio-Rad Laboratories QuantImmune Ferritin IRMA kit at the CDC central laboratory.
The CDC's own 1991 guidelines, which the TLC protocol appended, stated:
"Because iron deficiency can enhance lead absorption and toxicity and often coexists with it, all children with blood lead level ≥20 µg/dL should be tested for iron deficiency.... The serum ferritin level, however, is the most definitive and accurate indication of overall iron status.... a value <12 µg/L indicates iron deficiency."
Both sources agreed: ferritin should be measured, and it is the most sensitive indicator. TLC measured it. The question is what they did with it.
How Iron Deficiency Was Handled in Practice
The Design and Recruitment paper (1998) states: "If the child qualified but was iron deficient, a 30-day course of oral iron was prescribed and the child was scheduled to return in 1 month."
This implies that any child with iron deficiency would be identified, treated, and deferred before randomization. But the actual trial forms tell a different story.
The Visit 1 Lab Review Form determined eligibility and deferral based solely on hemoglobin and red cell distribution width (RDW). Item 12 asks: "Is the hemoglobin greater than or equal to 9.0 but less than 10.0 AND is the RDW increased?" — answering "Yes" triggers deferral. Ferritin is recorded (Item 20) but provides an option for "not available" and, critically, is not linked to the deferral or eligibility decision.
The Protocol (Version 10, Section 7.1.2) confirms this narrow definition:
"Children who are not iron deficient on the basis of the RDW or whose hemoglobin is greater than or equal to 10 g/dL will be enrolled."
This means a child with normal hemoglobin (≥10 g/dL) but critically low ferritin — a clear case of iron deficiency by the protocol's own definition in Section 8.3 — would be enrolled without treatment.
The Visit 2 Form then re-introduces ferritin: "Draw blood for CDC ferritin if V1 ferritin was less than 12 OR child required iron supplementation on the basis of V1 local lab results." But by Visit 2, no intervention had occurred to change the ferritin value — the child had simply been brought back for a second draw without receiving the iron supplementation the Design paper described.
In summary: the protocol acknowledged that ferritin was the most sensitive indicator of iron deficiency, measured it, but designed the eligibility and deferral forms to ignore it. Children who were iron-deficient but not anemic were randomized without treatment.
Where Ferritin Was Reported — And Where It Wasn't
Baseline ferritin was collected on 756 of 780 randomized participants. Its reporting across TLC publications:
The only time baseline ferritin for the randomized groups appeared in any TLC publication was in Peterson et al. (2004), a paper about the effect of succimer on growth — not cognition. The values, reported as arithmetic means:
Group
N
Ferritin (µg/L), Mean ± SD
Placebo
380
28.5 ± 19.6
Succimer
393
28.1 ± 17.6
The standard deviations (19.6 and 17.6) are nearly as large as the means — a hallmark of a right-skewed distribution where the arithmetic mean overstates the central tendency. Geometric mean would be the appropriate measure, and was not reported.
The Serwint Paper: A Different Sample
To address the question of iron status, TLC investigators published Serwint et al. (1999), which compared iron markers between TLC children and NHANES III children with lower blood lead levels. The paper concluded that there was no difference in iron status between the two groups, and therefore "laboratory investigation or empirical treatment for iron deficiency is not justified on the basis of moderately elevated blood lead levels alone."
This paper is frequently cited as evidence that iron deficiency was not a concern in TLC. However, a critical distinction is often missed:
Serwint 1999
TLC Randomized Cohort
Sample
787 African American children from the TLC screening cohort
780 children randomized to succimer or placebo
Source
Convenience sample of children recruited for eligibility screening
All children who completed screening, met criteria, and were randomized
Ferritin N
756
756 (per Peterson 2004)
Comparator
222 African American urban children from NHANES III with BLLs <10 µg/dL
None (no comparator in primary publications)
Serwint's sample (N=787) is the screening cohort — children who were recruited and had blood drawn at Visit 1, but were not necessarily randomized. The 780 randomized participants are a different group, selected from the screened pool after meeting all eligibility criteria. The two overlap substantially, but they are not the same sample.
More importantly, Serwint used a ferritin threshold of <10 µg/L to define iron depletion. This threshold is below what contemporary evidence supports:
ROC-derived; predicts microcytosis and cognitive impairment in healthy 2-year-olds
Neurodevelopmental research
<20–25 µg/L
Range associated with cognitive effects
At a threshold of <10, Serwint found iron depletion in 11% of TLC children. At a threshold of <20, the proportion would be substantially higher — but that analysis was never performed.
Arithmetic Mean vs. Geometric Mean
Ferritin distributions in children are characteristically right-skewed. A small number of children with very high ferritin values (due to inflammation, infection, or liver disease) pull the arithmetic mean upward, masking the proportion of children with low values.
Both Serwint (1999) and Peterson (2004) reported ferritin as the arithmetic mean. Neither reported the geometric mean, the median, or any distributional data that would allow assessment of the lower tail — where iron-deficient children would be.
The standard practice for ferritin reporting in pediatric populations is geometric mean with CRP adjustment, since ferritin is an acute-phase reactant that rises with inflammation even in iron-deficient states. CRP was not used to adjust ferritin values in any TLC publication.
Our analysis of NHANES 1999–2001 data for children ages 1–5 found:
Measure
Value
Arithmetic mean ferritin (all races, ages 1–5)
28.14 ng/mL
Median ferritin
22 ng/mL
Geometric mean ferritin (all races)
20.75 ng/mL (95% CI: 19.46–22.14)
The arithmetic mean (28.14) is 36% higher than the geometric mean (20.75). A median of 22 ng/mL means half of all children in this age range fall below a level considered physiologically concerning for neurodevelopment. The TLC arithmetic means (~28 µg/L) are consistent with this — but without distributional data, we cannot determine what proportion of TLC children had ferritin levels below clinically meaningful thresholds.
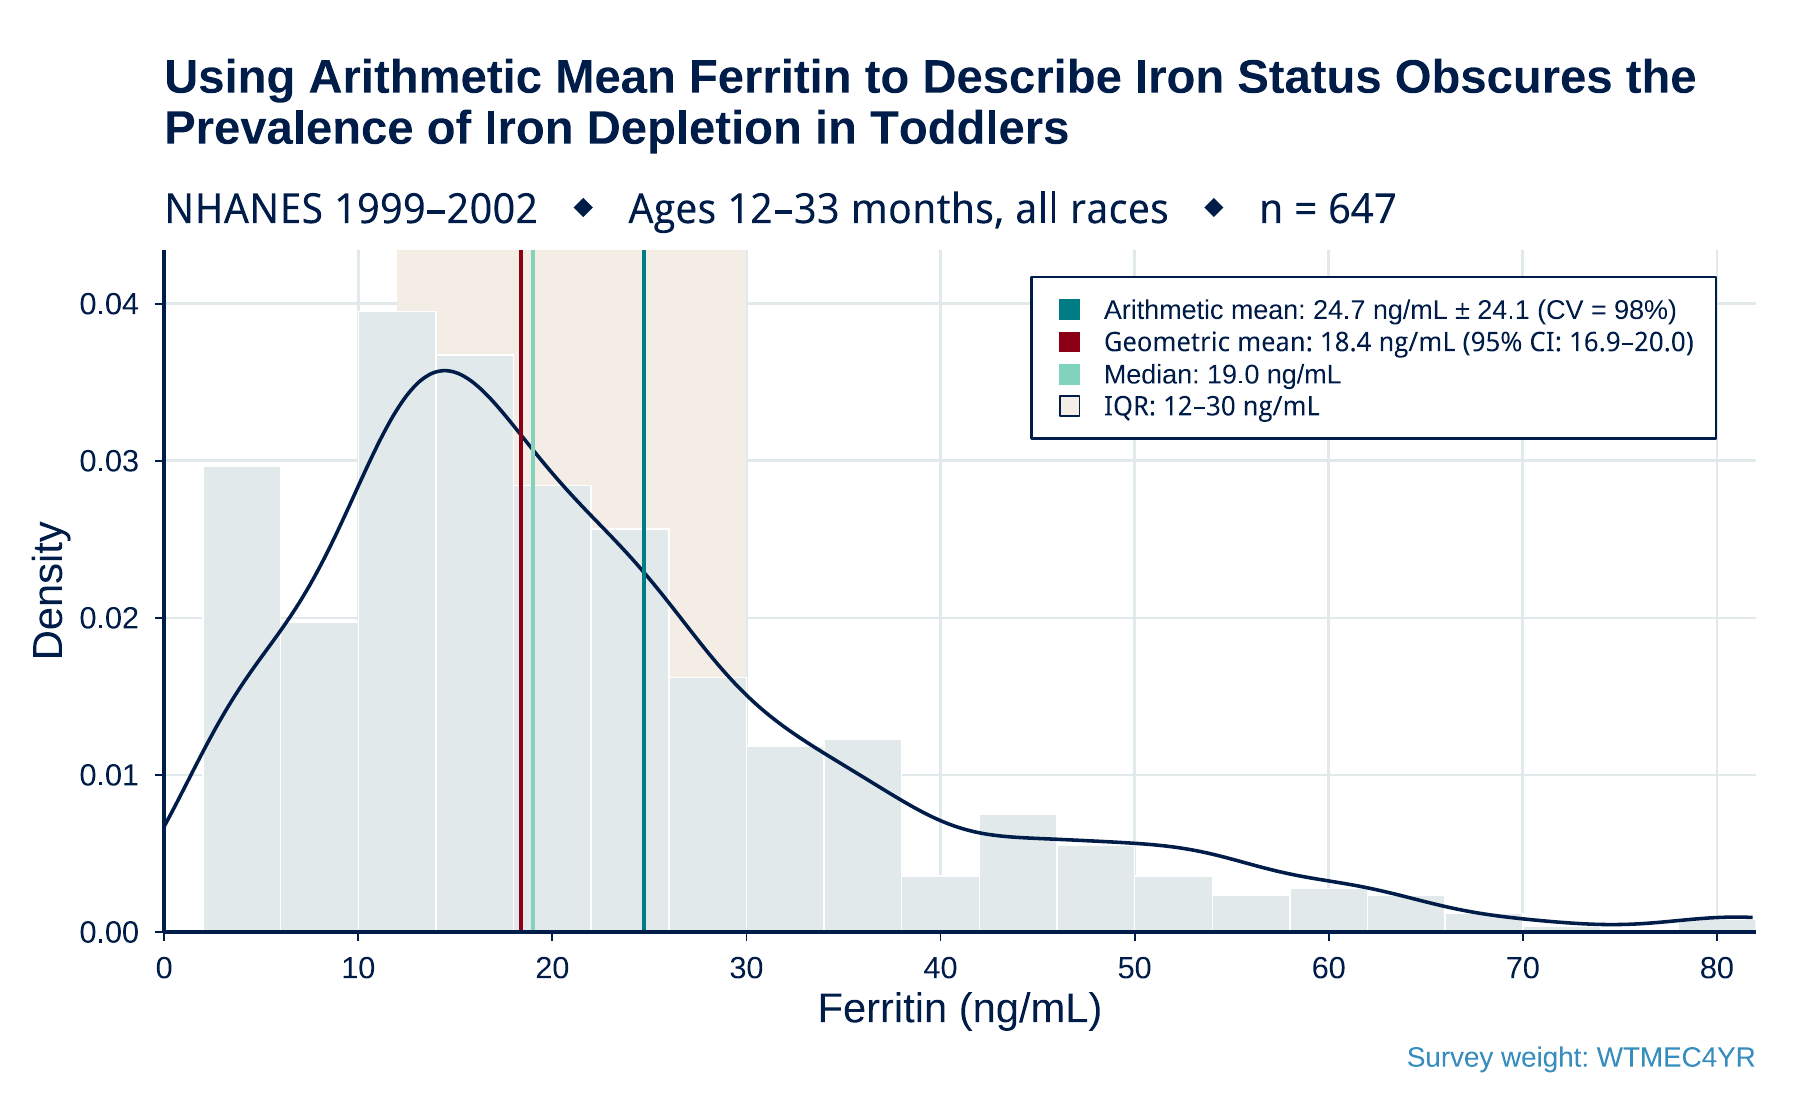
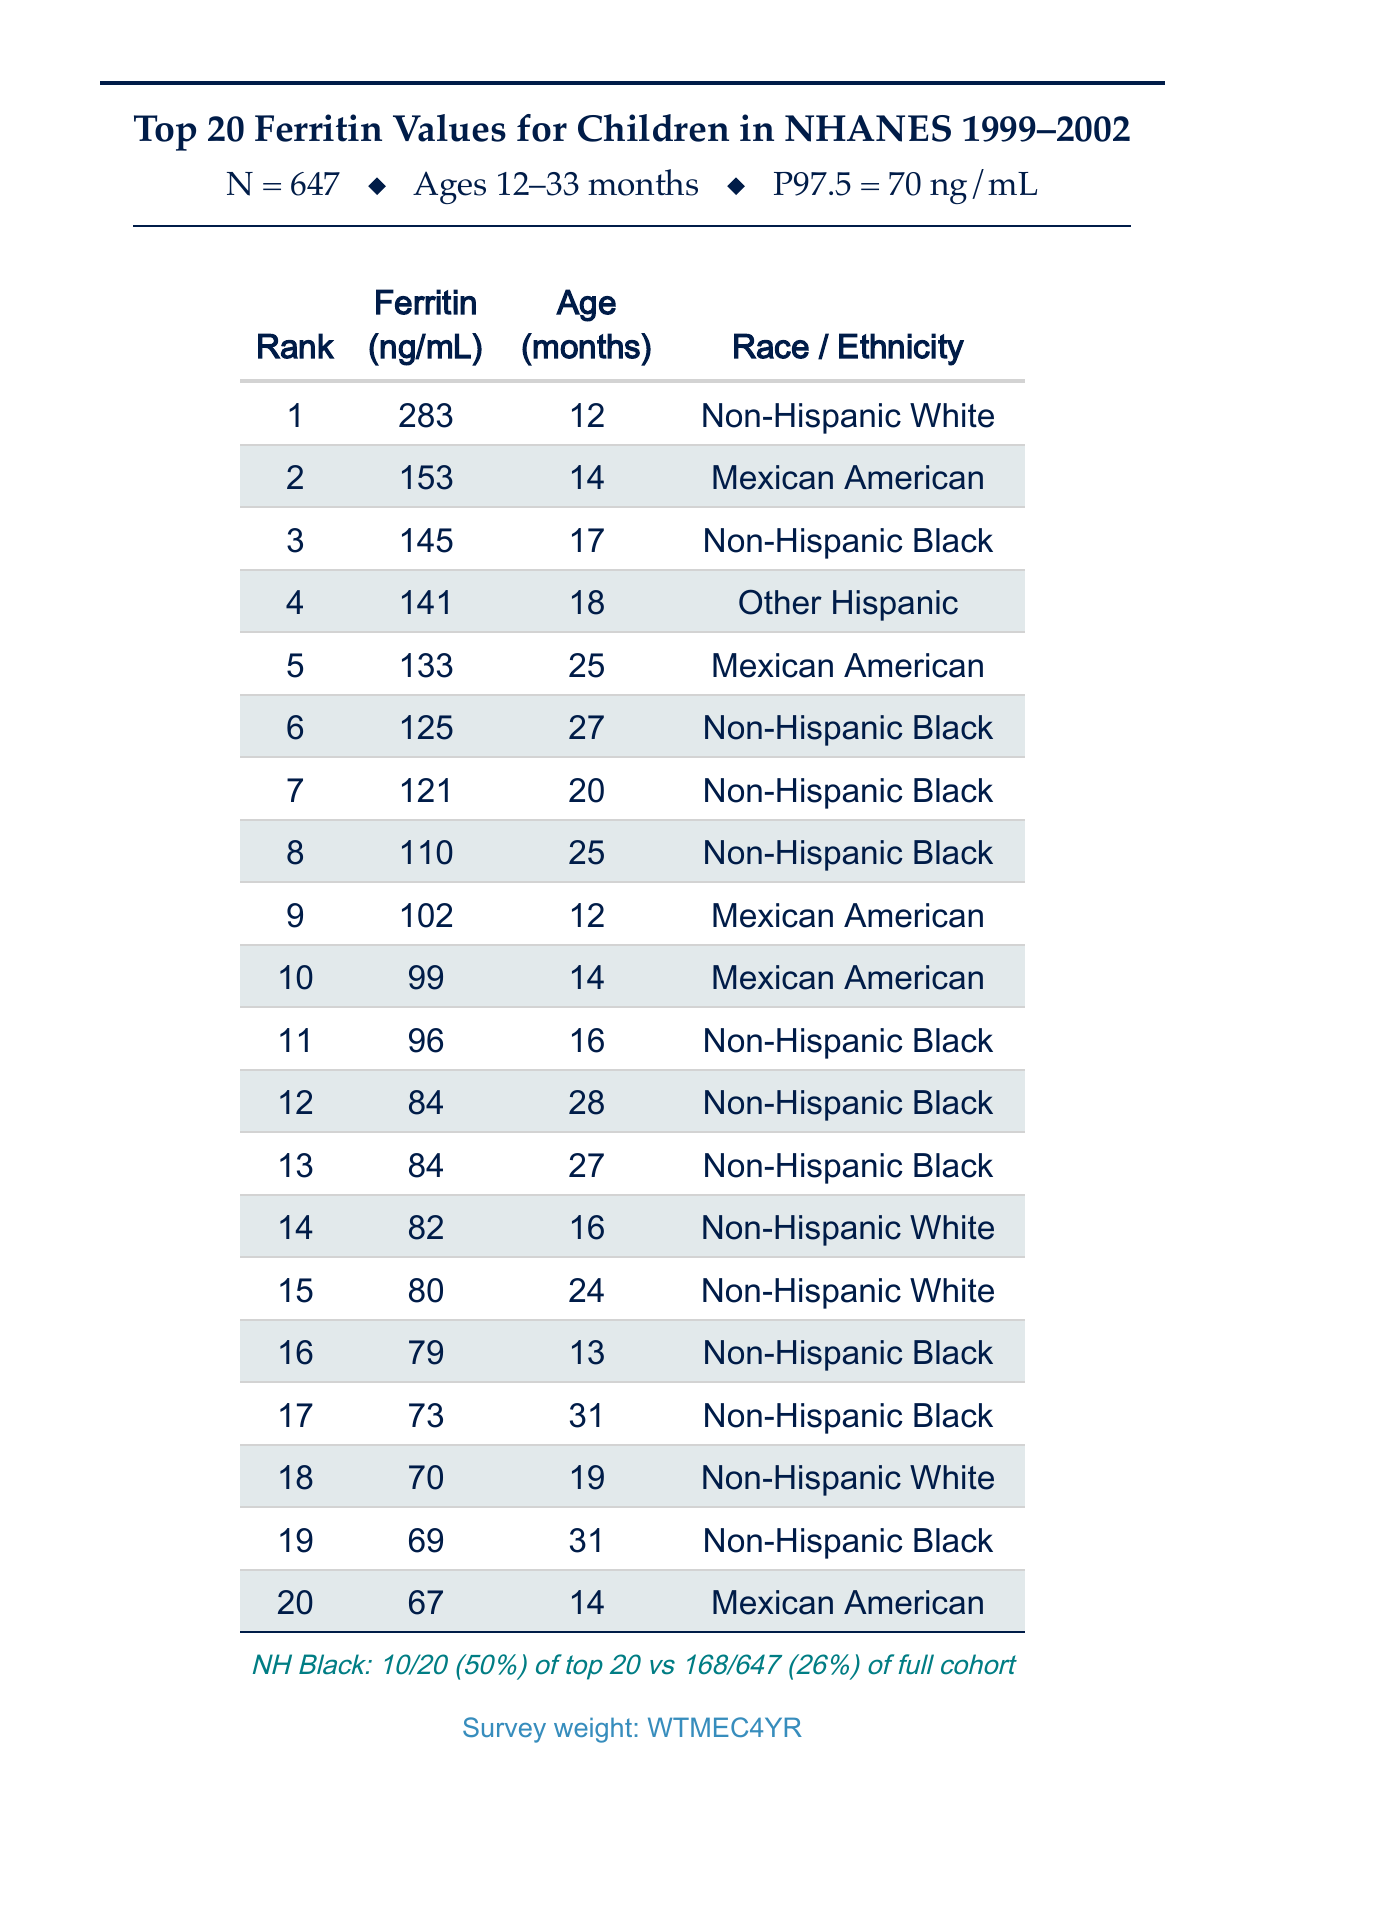
Narrowing the NHANES analysis to the exact TLC enrollment age window (12–33 months) sharpens the picture. The two figures below show the underlying distribution and the top of the tail that drives the arithmetic mean upward:
Figure 1. Distribution of ferritin values in NHANES 1999–2002 children ages 12–33 months (n = 647, all races) — the age window used by TLC. The arithmetic mean of 24.7 ng/mL overstates central tendency by ~35% relative to the geometric mean (18.4 ng/mL) and the median (19.0 ng/mL). The coefficient of variation is 98%, indicating an unusually wide and skewed distribution. The TLC publications report ferritin as arithmetic mean only — a measure that in this distribution is a poor summary of iron status and obscures the prevalence of depletion. (Click to open full-resolution PDF.)Figure 2. The 20 highest ferritin values in the same NHANES 1999–2002 cohort (ages 12–33 months). Values range from 67 to 283 ng/mL, well above the 97.5th percentile of 70 ng/mL. Non-Hispanic Black children account for 10 of the top 20 values (50%) — compared to 26% of the full cohort. Ferritin is an acute-phase reactant; high values typically reflect inflammation or infection, not iron repletion. In a trial population that was ~76% Black, an arithmetic mean ferritin will be systematically inflated by inflammation-driven outliers, further obscuring depletion prevalence. (Click to open full-resolution PDF.)
Why This Matters
The TLC investigators acknowledged that ferritin was the most sensitive indicator of iron status. They measured it. They appended CDC guidelines stating that all children with BLLs ≥20 should be tested for iron deficiency and that ferritin <12 indicates deficiency. Then they designed eligibility forms that ignored ferritin values, reported ferritin in only one of five major publications (as an arithmetic mean covariate), published a separate paper on a different sample using an insensitive threshold, and never analyzed whether iron status modified the treatment effect on IQ.
If iron-deficient children — who absorb more lead and are independently at risk for cognitive impairment — respond differently to chelation than iron-replete children, the failure to account for this would dilute or mask any treatment effect. This is not a hypothetical concern. It is a testable hypothesis, and the data to test it exists in the TLC dataset.